1. Introduction
Waxy crude oil, characterized by its high wax content, poses significant challenges in oil production, transportation, and processing. At low temperatures, waxy crude oil tends to undergo phase transformations, resulting in the formation of solid wax crystals that can cause flow restrictions and operational difficulties in pipelines and equipment
| [4] | Bai, Y., Bai, Q., & Wang, X. (2018). Subsea engineering handbook (2nd ed.). Gulf Professional Publishing. |
[4]
.
Crude oil is a complex mixture of hydrocarbons, including paraffins, naphthenes, and aromatics. The wax content in crude oil varies depending on the oil source and composition, with some crudes containing higher amounts of waxes than others. Waxes are high-molecular-weight hydrocarbons that exhibit solid-like behavior at lower temperatures due to the close packing of their molecular chains
| [13] | Yarranton, H. W., & Masliyah, J. H. (2009). Crystallization and precipitation in waxy crude oils. Fuel Processing Technology, 90(7-8), 933-939. |
[13]
.
The phase transformations of waxy crude oil with temperature change have been extensively studied to understand the underlying mechanisms and predict the conditions under which wax precipitation occurs. Wax deposition can occur at various stages, including the pour point, cloud point, and wax appearance temperature (WAT). The pour point is the lowest temperature at which the crude oil ceases to flow under standard test conditions, while the cloud point represents the temperature at which the first appearance of wax crystals is observed in the liquid phase
| [9] | Ondrey, G. (2012). Flow assurance: Predicting the pour point and wax appearance temperature. Chemical Engineering Progress, 108(6), 28-34. |
[9]
.
Previous research has shown that the phase behavior of waxy crude oil is influenced by factors such as the composition and concentration of waxes, solvent quality, cooling rate, and pressure
| [4] | Bai, Y., Bai, Q., & Wang, X. (2018). Subsea engineering handbook (2nd ed.). Gulf Professional Publishing. |
| [9] | Ondrey, G. (2012). Flow assurance: Predicting the pour point and wax appearance temperature. Chemical Engineering Progress, 108(6), 28-34. |
[4, 9]
. Additionally, the presence of impurities and additives in crude oil can affect the phase behavior and alter the temperature at which phase transformations occur
| [7] | Hansen, J. P., Larsen, C. L., & Lindeloff, N. (2016). The influence of crude oil impurities on wax appearance temperature. Fuel Science and Technology International, 34(6), 479-488. |
[7]
.
The problem associated with waxy crude Flow assurance in waxy crude refers to the set of measures and strategies employed to ensure the uninterrupted flow of crude oil containing waxes through production, transportation, and processing systems. Waxy crude oil contains a significant number of waxes, which can solidify and cause flow-related issues at lower temperatures. This waxy crude can also cause production loss due to obstruction of pipeline, wellhead, separator etc. For the obstruction to be remove and production restarted, the deposited waxy will have to be remediated which incur and additional cost.
While significant research has been conducted on waxy crude oil phase behavior, there is still a need for further investigation, especially concerning the specific temperature ranges and conditions that trigger phase transformations and the impact of various parameters on the process.
Waxy crude oil is known for its propensity to undergo phase transformations, leading to the formation of solid wax crystals at low temperatures. These phase transitions pose significant challenges in oil production, transportation, and processing operations. Understanding the phase behavior and temperature-induced phase transformations of waxy crude oil is crucial for developing effective strategies to mitigate flow restrictions, equipment blockages, and operational difficulties caused by wax deposition. This study aims to investigate the phase transformation on temperature change in waxy crude. Phase transformation; phase transition, melting, product stability.
Handling waxy crude presents a multitude of challenges in Nigeria's petroleum industry, which is characterized by its significant production of waxy crude oils. These challenges span various stages of crude oil exploration, production, transportation, and refining.
The primary challenge in handling waxy crude lies in ensuring continuous and efficient flow throughout the production and transportation processes. As temperature decreases, waxy components in the crude oil tend to solidify and form wax crystals. These crystals can agglomerate, leading to the development of gel-like structures that hinder flow in pipelines and equipment
| [10] | Ofoegbu, G. I., Adeyemi, O., & Duru, C. E. (2019). Wax deposition in Nigerian crude oil pipelines: Problems and solutions. Journal of African Petroleum Research, 6(3), 233-243. |
[10]
. Flow assurance challenges result in reduced production rates, increased energy consumption, and potential equipment damage.
Wax deposition in pipelines can lead to partial or complete blockages, necessitating frequent maintenance and shutdowns for cleaning. The accumulation of wax deposits can reduce pipeline throughput capacity and disrupt operations, causing financial losses
| [8] | Hakim, A., Yusuf, O. A., & Ibrahim, M. (2019). Health and safety risks associated with wax deposition in crude oil pipelines. Journal of Occupational Safety and Health, 12(2), 121-129. |
[8]
. Mitigating pipeline blockages requires substantial efforts and resources.
Wax deposition on equipment surfaces, such as valves, pumps, and heat exchangers, can lead to fouling and corrosion. The interaction between wax deposits and other impurities may exacerbate corrosion issues, reducing equipment lifespan and increasing maintenance costs
| [11] | Ofori-Sarpong, G., Frimpong, S. K., & Amankwah, R. K. (2019). Environmental impacts of wax removal methods in oil pipelines. Journal of Environmental Management, 238, 324-331. |
[11]
. The need for frequent cleaning and maintenance to address wax- related issues can result in operational delays and increased operating costs. Shutdowns for maintenance disrupt production schedules and revenue generation
| [6] | Ghosh, R., Bandyopadhyay, S., & Bhattacharyya, K. K. (2017). Environmental impact of wax deposition in oil pipelines: A case study. Environmental Engineering Science, 34(10), 733-741. |
[6]
.
To prevent wax deposition and maintain flow, flowlines may require insulation and heating systems. The installation and maintenance of these systems add to operational expenses
| [3] | Adenikinju, A., Okonkwo, O., & Onuoha, C. (2019). Cost implications of pipeline wax management in Nigeria. Energy Economics Review, 45(4), 75-84. |
[3]
. The challenges posed by waxy crude necessitate careful resource allocation and management strategies. Investments in research, technology, and equipment are required to address wax-related issues and ensure efficient crude oil production and transportation
| [2] | Aliyu, A., Sulaimon, A. A., & Yahaya, H. (2018). Impact of wax deposition on crude oil production in Nigerian pipelines. Nigerian Journal of Technology, 37(2), 211-218. |
[2]
.
Wax-related challenges can result in unintended environmental consequences. Operational disruptions, maintenance activities, and potential spills during cleaning can have ecological impacts on local ecosystems
| [11] | Ofori-Sarpong, G., Frimpong, S. K., & Amankwah, R. K. (2019). Environmental impacts of wax removal methods in oil pipelines. Journal of Environmental Management, 238, 324-331. |
[11]
. Waxy crude can pose challenges during the refining process, affecting product yields and quality. The presence of wax can lead to higher energy consumption during refining and impact the properties of refined products
| [1] | Akinlua, A., Fajemila, O. T., & Ogunyemi, O. M. (2020). Challenges and prospects of refining waxy crude oils in Nigeria. Journal of Petroleum Research and Development, 38(1), 89-102. |
[1]
.
Maintenance activities related to wax deposition carry inherent health and safety risks for workers. Exposure to hazardous materials and the need for frequent equipment inspections can compromise safety protocols
| [8] | Hakim, A., Yusuf, O. A., & Ibrahim, M. (2019). Health and safety risks associated with wax deposition in crude oil pipelines. Journal of Occupational Safety and Health, 12(2), 121-129. |
[8]
. Developing effective solutions for waxy crude handling requires advancements in research and technology. Gaps in understanding the complex mechanisms of wax deposition and effective mitigation strategies present ongoing challenges
| [5] | Bannat, N. A., El-Gendy, N. S., & Awad, M. M. (2016). Advances in wax inhibition technologies in petroleum flow assurance. Petroleum Science and Engineering, 147, 362-370. |
[5]
.
Handling waxy crude in Nigeria's petroleum industry poses a range of challenges, including flow assurance issues, pipeline blockages, equipment fouling, operational delays, and environmental concerns. These challenges necessitate the implementation of innovative strategies, technologies, and research efforts to ensure the efficient production, transportation, and processing of waxy crude oil.
The handling of waxy crude in Nigeria's petroleum industry has profound environmental and economic implications, stemming from the challenges associated with wax formation, deposition, and flow assurance. This section explores the significant effects on the environment and economy, drawing insights from relevant studies and research findings.
The challenges posed by wax deposition can lead to operational disruptions and spills during maintenance activities, potentially impacting local ecosystems and water bodies. These incidents can introduce pollutants and disrupt the balance of aquatic habitats
| [11] | Ofori-Sarpong, G., Frimpong, S. K., & Amankwah, R. K. (2019). Environmental impacts of wax removal methods in oil pipelines. Journal of Environmental Management, 238, 324-331. |
[11]
. Wax-related issues, such as increased viscosity and equipment fouling, may lead to higher energy consumption during crude oil production, transportation, and refining. This elevated energy use can contribute to greenhouse gas emissions and environmental degradation
| [6] | Ghosh, R., Bandyopadhyay, S., & Bhattacharyya, K. K. (2017). Environmental impact of wax deposition in oil pipelines: A case study. Environmental Engineering Science, 34(10), 733-741. |
[6]
.
Maintenance activities involving cleaning and removal of wax deposits generate waste materials that require proper disposal. Improper waste management can lead to soil and water contamination, posing environmental risks
| [8] | Hakim, A., Yusuf, O. A., & Ibrahim, M. (2019). Health and safety risks associated with wax deposition in crude oil pipelines. Journal of Occupational Safety and Health, 12(2), 121-129. |
[8]
. Frequent operational disruptions and maintenance activities in crude oil facilities can disrupt habitats and wildlife in surrounding areas. Noise pollution, land disturbance, and changes in water quality can affect the local ecosystem
| [11] | Ofori-Sarpong, G., Frimpong, S. K., & Amankwah, R. K. (2019). Environmental impacts of wax removal methods in oil pipelines. Journal of Environmental Management, 238, 324-331. |
[11]
. Flow assurance challenges due to wax deposition can lead to reduced crude oil production rates and revenue generation. Frequent shutdowns for maintenance and cleaning impact the overall productivity of oilfields and production facilities
| [3] | Adenikinju, A., Okonkwo, O., & Onuoha, C. (2019). Cost implications of pipeline wax management in Nigeria. Energy Economics Review, 45(4), 75-84. |
[3]
. Wax-related challenges necessitate additional investments in technology, equipment, and maintenance. The costs associated with flow assurance strategies, such as heating systems and insulation, contribute to higher operating expenses
| [2] | Aliyu, A., Sulaimon, A. A., & Yahaya, H. (2018). Impact of wax deposition on crude oil production in Nigerian pipelines. Nigerian Journal of Technology, 37(2), 211-218. |
[2]
. Mitigating wax-related challenges requires significant investment in infrastructure, including the installation of heating systems, flowline insulation, and maintenance facilities. These investments divert resources that could be allocated for other development projects
| [8] | Hakim, A., Yusuf, O. A., & Ibrahim, M. (2019). Health and safety risks associated with wax deposition in crude oil pipelines. Journal of Occupational Safety and Health, 12(2), 121-129. |
[8]
. The uncertainty surrounding the availability and flow of waxy crude can impact market stability and pricing. Variability in production and transportation due to wax-related issues can lead to market fluctuations and impact revenue projections
| [6] | Ghosh, R., Bandyopadhyay, S., & Bhattacharyya, K. K. (2017). Environmental impact of wax deposition in oil pipelines: A case study. Environmental Engineering Science, 34(10), 733-741. |
[6]
.
Refineries processing waxy crude may incur higher operational costs due to the need for additional energy to manage wax-related challenges. Additionally, the presence of wax can affect product yields and quality, further impacting refining economics
| [1] | Akinlua, A., Fajemila, O. T., & Ogunyemi, O. M. (2020). Challenges and prospects of refining waxy crude oils in Nigeria. Journal of Petroleum Research and Development, 38(1), 89-102. |
[1]
. Environmental regulations and compliance requirements related to wax-related incidents can lead to legal and regulatory costs. Oil companies may need to allocate resources for environmental impact assessments and compliance measures
| [11] | Ofori-Sarpong, G., Frimpong, S. K., & Amankwah, R. K. (2019). Environmental impacts of wax removal methods in oil pipelines. Journal of Environmental Management, 238, 324-331. |
[11]
.
The handling of waxy crude in Nigeria has far-reaching environmental and economic implications. The challenges associated with wax deposition and flow assurance impact local ecosystems, contribute to energy consumption and emissions, and impose significant economic costs on the petroleum industry. Addressing these implications requires a multidisciplinary approach that encompasses environmental management, technology development, and economic planning.
2. Materials and Method
The crude oil samples were obtained from a field in Niger Delta. The experiments were run in Reservoir Fluid Laboratory in Port Harcourt and the materials utilized for the experimental work is summarized in
Table 1 and
Table 2 below.
Table 1. Crude oil samples used for the study.
Material | Sample | Remark |
Crude Oil | X | Obtained From Field in Niger Delta |
Crude Oil | Y | Obtained From Field in Niger Delta |
Table 2. Apparatus for experiment and their uncertainties.
| Equipment | Remark | Uncertainty |
1 | Pour Point Apparatus | for pour point temperature of the waxy crude oil | |
2 | Anton PaarSVM3000/G2 Viscometer | for viscosity of the waxy crude oil | 0.16% |
3 | Density Bottle | for density of crude oil | |
4 | Electric Weighing Balance | for weighing density bottle | 1% |
5 | Stop Watch | to measure the time, it takes for the sample to start flowing | 0.01% |
7 | Sample container | For holding the waxy crude oil samples | 0.1ml |
8 | Thermometer | For measuring the temperature of the sample during the test. | 0.5 0C |
9 | Cooling bath | For cooling the crude oil samples | |
10 | Measuring Cell | A small chamber that holds the sample during the test | 0.05ml |
11 | Pipette | Used to transfer the sample from the sample container to the measuring cell | 0.006ml |
12 | Temperature Control Unit | Is used to maintain the sample at a constant temperature during the test. | 0.05% |
13 | DSC | Is used for appearance temperature | 0.05% |
Method
Characterization of Crude Oil
SG helps to monitor the quality of the crude oil and to establish its price. The Crude oil specific gravity was determined using the hydrometer method. API gravity is used to determine the performance of the crude oil. API gravity (29°C) calculated using the relationship (3.8).
The standard acetone method (UOP 46-64 method) was used to take out the wax from the crude oil sample. A sample of the crude oil was measured and weighed into a 100ml beaker. Then 25ml of toluene was added to the sample and stirred for 5 minutes. Again, 5g of fuller’s earth (aluminum silicate) was weighed and added to the mixture to make the sample clear of all polar materials in the oil. Subsequently, the toluene was removed from the sample by evaporation in the oven at 45 oC. Then, the deposit was redissolved in ether-acetone mixture in a ratio of 3: and was put into a freezer at -17°C for two hours. Then, the solution was filtered through a filter paper which was already weighed. The filtrate (precipitated wax) on the filter paper was dried in an oven at 45°C. The wax content was determined using the formula:
Wax content = -- (3.1)
The test jar was slid into O-ring and the heated crude oil samples were poured into the test jar to the required level and the test jar with high pour point thermometer was closed and corked while the cork was adjusted until the thermometer bulb was immersed in the crude oil with the end of the thermometer at 3mm above the bottom of the test jar and with the cleaned, dried copper test jacket, metal weight, cork disc, the copper test jacket was inserted into the CFPP adaptor while the metal weight, cork disk respectively was inserted into the copper test jacket. The test jar was put into the copper test jacket and the setup was covered with the insulating sponge to prevent the formation of frost and the appearance of the crude oil sample was examined when the temperature was at 9°C above the pour point and thereafter at every 3°C decrease in temperature, the condense moisture that limits visibility was removed by wiping the surface with a clean cloth moistened in alcohol gently in 3 seconds and ensured that spongy network of wax crystal formed was not disturbed and it came to point where the crude oil samples showed no sign of movement when held horizontally for 5 seconds and the observed reading on the thermometer was recorded.
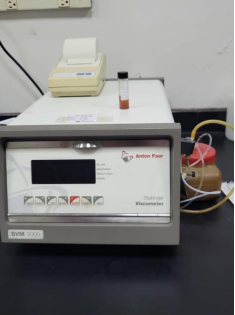
Figure 1. The Anton Paar SVM3000/G2 Viscometer.
The equipment was turned on with the power button on the rear of the equipment and a self-test and initialization procedure with dots on the display which signaled the progress of the procedure for SVM- 3000 and the dot printer was turned on. The wash bottles were filled with hexane and the tip of the wash bottle was attached to the outer inlet of the filling support, the cells were filled with solvent until it was visible from about 2-3 cm in the waste hose and the wash bottle was detached from the support in a way that it does not suck back contaminated solvent into the wash bottle. The “START” key was Pressed as shown in
Figure 1 to allow the motor to run for about 10 seconds and then the “START” key was pressed to terminate this process. Again, the air hose was attached to the outer inlet of the filling support and PUMP was pressed to blow dry the cell. This process was repeated to ensure that the measuring cell was cleaned thoroughly. The density of a clean dry cell is 0.0015*0.0005. A disposable syringe was filled with bubble free sample and the syringe was attached to the outer-inlet of the filling support and at least 2ml of sample was displaced smoothly without excess pressure into the measuring cell. The “START" Key was pressed to start the motor for about 10 seconds, this ensured that the measuring cell was properly wetted with the sample before the measurement and "START was pressed to stop the motor. Again, another 1ml or more was filled till the sample was visible at the waste hose. Then "START “was pressed and the density and viscosity of the sample was measured. The result, on completion of measurement was printed out via the printer.
The DSC instrument was calibrated with certified reference materials and cleaned crucibles with sealed lid were used to prevent contamination and ensure consistent heat transfer and samples were weighed accurately to maintain data integrity. Samples and empty reference crucible were placed in their respective cells, ensuring proper alignment and contact with sensors and desired temperature range were inputted, 80°C /-10°C heating/cooling rates, and purge gas flow rate was at 5cm3/s and then the experiment started and closely monitored progress for any anomalies or errors. The instrument automatically collected and stored heat flow and temperature data for analysis and using appropriate software to analyze the collected data, identifying thermal events and the WAT was determined.
Phase transformation of the waxy crude oil samples was studied using DSC. The samples were heated to 75°C and kept at that temperature for 10 minutes to erase the samples thermal history. Following this 10-min isothermal step, the samples were cooled to 11°C at the rate of 1°C/min and kept at that temperature for 10 min. In the last step, the sample was re-heated to 75°C at a rate of 1°C/min and results were obtained. The crude oil sample was placed on the microscopic observation platform for heating, and the wax is melted in the crude oil completely and then cooled at a constant cooling rate of 1°C/min.
3. Results and Discussion
Results of the Characteristic Properties of the Waxy Crude Oil Samples indicate that, as the temperature of the crude oil sample decreases with a corresponding heat loss at each temperature wax crystallization sets in, however, wax crystallization starts at 20°C and passes through heat loss phases up to a point where crystallization ended at 15°C, this point is referred to as the WAT.
Table 3 shows that, as the temperature of the crude oil sample decreases with a corresponding heat loss at each temperature wax crystallization sets in, however, wax crystallization starts at 25°C
and passes through heat loss phases up to a point where crystallization ended at 20°C, this point is referred to as the WAT.
Table 3. Temperature of oil Samples.
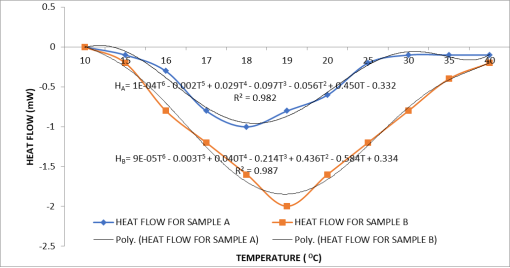
Figure 2. Heat Flow (mW) against Temperature (°C).
Figure 2 is a heat for low-temperature profile that shows the temperature at which wax appears. The plot suggests several key differences between the samples. Sample A displayed a sharper, narrower peak of wax crystallization compared to the broader, more gradual peak observed for Sample B. Additionally, the onset of wax crystallization (WAT) for Sample B occurred at a lower temperature (25°C) compared to Sample A (20°C), further supporting the presence of more wax and its earlier crystallization tendency.
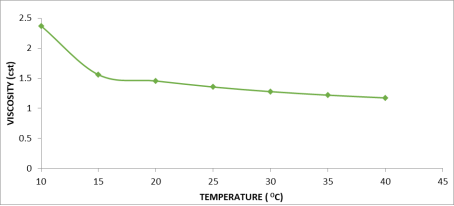
Figure 3. Plot of viscosity (cst) against Temperature (°C) of crude oil sample A.
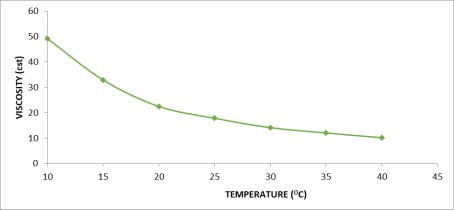
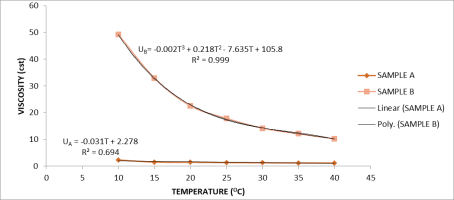
Figure 4. Plot of viscosity (cst) against Temperature (°C) of crude oil sample B.
Figure 5. Plot of viscosity (cst) against Temperature (°C) of crude oil samples A and B.
The viscometer measurements demonstrated a significant decrease in viscosity for both samples with Increasing temperature. However, Sample B consistently exhibited higher viscosity values across the entire temperature range (10-40°C). This implies a larger presence of waxes in Sample B, hindering its flow at lower temperatures
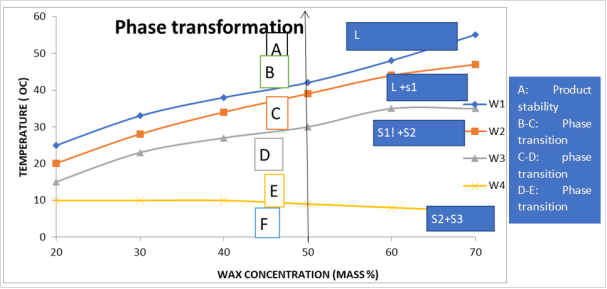
Figure 6. Temperature-wax concentration Diagram for the crude oil samples system A.
Figure 6 presents an isobaric temperature-wax concentration phase Diagram for the sample A, which is prepared from the results of a number of DSC cooling thermo grams according to
| [12] | Tiwary, P. (2002). Crude oil wax deposition modeling using DSC thermograms. Petroleum Research, 11(2), 67-75. |
[12]
. In
Figure 6, a vertical line, corresponding to 50% wax, was drawn for describing the different phase regions and boundaries. At a relatively high temperature (point A), the mixture exists as a liquid phase (L). Upon cooling the mixture, a temperature is reached where the higher melting wax constituents or components of paraffin wax would start to separate to form a solid phase. Again, point B corresponds to the temperature where 5% of the wax has crystallized and point C corresponds to the temperature for 95% wax crystallization. Thus, points B and C mark the boundaries of the range of temperatures over which the wax crystallization process occurs. Between points B and C, two phases would be present, a liquid (L) and a solid (S1). As the temperature is decreased further to point D, the solid-solid (S1-S2) phase transition corresponding to the β-peak for pure wax would take place. Hence, at temperatures between points D and E, a liquid (L) and a second solid phase (S2) would co-exist. Point E marks the liquid-solid transition for the lower melting component of the crude oil samples mixture, yielding the third solid phase (S3). At temperatures lower than that corresponding to point E, two solid phases, S2 and S3, would be present.
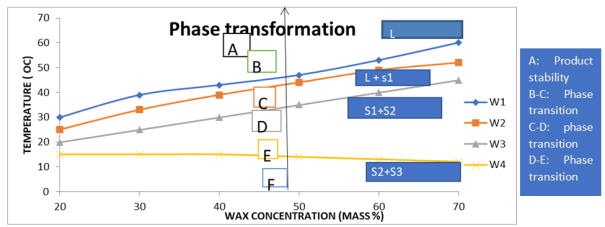
Figure 7. Temperature-wax concentration Diagram for the crude oil samples system B.
Figure 7: presents an isobaric temperature-wax concentration phase Sample B diagram was develop using the outcome of multiple DSC Cooling thermo grams, according to
| [12] | Tiwary, P. (2002). Crude oil wax deposition modeling using DSC thermograms. Petroleum Research, 11(2), 67-75. |
[12]
.
Figure 7 depicts a vertical line that represents 50% of the wax mass to describes the different phase regions and boundaries. The mixture will transition into liquid phase (L) when the temperature is relatively high (point A). Once the mixture is cooled, a temperature where higher melting wax constituents or components of paraffin wax are to be separated and formed into an intermediate phase shall be established. Point B is equal to the temperature at which 5% of wax has been crystallized and point C corresponds to the temperature for melting 95% waxes. The boundaries of the temperature range within which wax crystallization takes place shall therefore be indicated in points B and C. Between points B and C, two phases would be present, a liquid (L) and a solid (S1). As the temperature is decreased further to point D, the solid-solid (S1-S2) phase transition corresponding to the β-peak for pure wax would take place. Hence, at temperatures between points D and E, a liquid (L) and a second solid phase (S2) would co-exist. Point E marks the liquid-solid transition for the lower melting component of the crude oil samples mixture, yielding the third solid phase (S3). At temperatures lower than that corresponding to point E, two solid phases, S2 and S3, would be present.
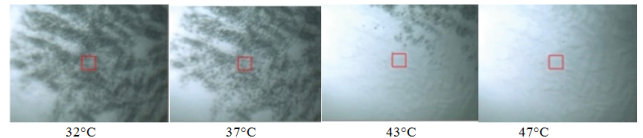
Figure 8. The phase state of wax crystals changes at typical temperatures sample A (Melting point).
Figure 8 shows the phase distribution of the samples at a typical temperature, the waxy crude oil samples was placed on the thermostatic heating platform of the microscope, and a temperature rise and melting experiment was achieved.
However, as can be seen from
Figure 8, when the temperature of the crude oil reached the freezing point, the entire crude oil sample lost its fluidity due to the formation of a strong cross-lattice structure between a large number of wax crystals. At this time, the small amount of liquid oil in the grid was basically at rest due to the restriction of the grid. When the crude oil was heated, the original wax crystal skeleton kept melting, the mesh effect gradually decreased, and the mobility of the melted crude oil and the crude oil in the pore space increased. At this point, the crude oil presented the characteristics of a porous medium. The aggregation point was the temperature of the crude oil corresponding to the disappearance of the grid properties of the porous medium during the heating process. Its determination was done by microscopic experimental pictures, using pixel tracking method, and several wax crystal points were randomly selected to observe the pixel position of each point during the heating process. When the grid structure disappeared, the wax crystal point position will change significantly due to the natural convection effect inside the crude oil during the heating process, so the temperature of the agglomeration point can be determined according to the displacement change of the wax crystal point. When the crude oil continues to be heated, the lattice structure disappeared and only a small amount of wax crystals is suspended in the liquid crude oil, as shown in the wax crystal diagram at 47°C. When the temperature of the crude oil was higher than the wax evolution point, all the wax crystals melt away and all the crude oil samples were liquid.
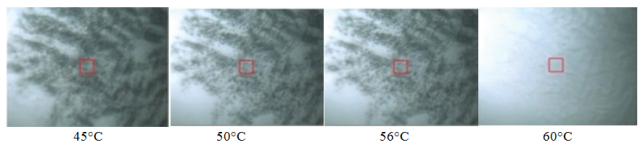
Figure 9. The phase state of wax crystals changes at typical temperatures sample B (Melting point).
Figure 9 shows the phase distribution of the samples at a typical temperature, the waxy crude oil samples was placed on the thermostatic heating platform of the microscope, and a temperature rise and melting experiment was achieved. However, as can be seen from
Figure 9, when the temperature of the crude oil reached the freezing point, the entire crude oil sample lost its fluidity due to the formation of a strong cross lattice structure between a large numbers of wax crystals. As a result of the grid restrictions, the small amount of liquid oil on the grid was at a standstill at the time. The original wax crystal skeleton continued to melt, the mesh effect decreased, and the movement of the melted crude oil and the crude oil in the pore space increased when the crude oil was heated. Crude oil showed the characteristics of a transparent medium at this point. The aggregation point was the crude oil temperature corresponding to the loss of the grid properties of the porous medium during the heating process. In order to determine the pixel position of each point during the heating process, microscopic experimental photographs were taken using the pixel tracking method, and several wax crystal points were randomly selected. When the grid structure is removed, the position of the wax crystal point changes significantly due to the natural convection effect in the crude oil during the heating process, so that the temperature of the agglomeration point can be determined by the displacement of the wax crystal point. As shown in the wax crystal diagram at 60°C, when crude oil is heated for a longer period of time, its lattice structure disappears and only small amounts of waxes are suspended. All the wax crystals melted away and all the crude oil samples were liquid when the temperature of the crude oil was higher than the wax evolution point.
The combined results provide a comprehensive picture of the wax crystallization behavior of Samples A and B. The lower pour point and viscosity of Sample A highlight its suitability for applications requiring flow at colder temperatures. In contrast, Sample B's higher wax content and lower WAT pose a greater risk of wax deposition and flow impediments under similar conditions.
The DSC readings offer valuable insights into the kinetics and thermodynamics of wax crystallization. The sharper peak and higher peak temperature for Sample A suggest a faster and more localized wax crystallization process. Conversely, the broader peak and lower WAT for Sample B indicate a slower, more gradual and dispersed crystallization process. This difference in crystallization behavior could influence the texture and potential plugging risks associated with wax deposition in pipelines or other equipment.
The combined investigation of pour point, viscometer, and DSC analysis provides valuable insights into the wax crystallization behavior of Samples A and B. The results highlight the significant influence of wax content and crystallization characteristics on flow properties. Sample A's lower pour point and viscosity suggest its suitability for colder environments, while Sample B's higher wax content and lower WAT indicate a greater risk of wax deposition and flow challenges.